

February 2026
For definitions and explanations of the numbers and charts below, read this article.
Summary
- Asset classes: Top Gold +8.72% vs. Bottom Bitcoin USD −21.91% vs. All Country World Index +1.29%
- Countries: Top Korea, Republic of +23.60% vs. Bottom Denmark −11.26% vs. All Country World Index +1.29%
- Volatility: Short-Term 19.95 vs. Medium-Term 23.68 vs. 10-Year Average 18.38
- Currencies: Top AUD Index +1.52% vs. Bottom JPY Index −1.59%
- US sectors: Top Utilities +10.36% vs. Bottom Financials −3.82% vs. S&P-500 Index −0.84%
- pfolio portfolios: Top ETF - High Volatility +14.07% vs. Bottom ETF - ESG - Low Volatility +2.13% vs. All Country World Index +1.29%
Markets
Asset classes
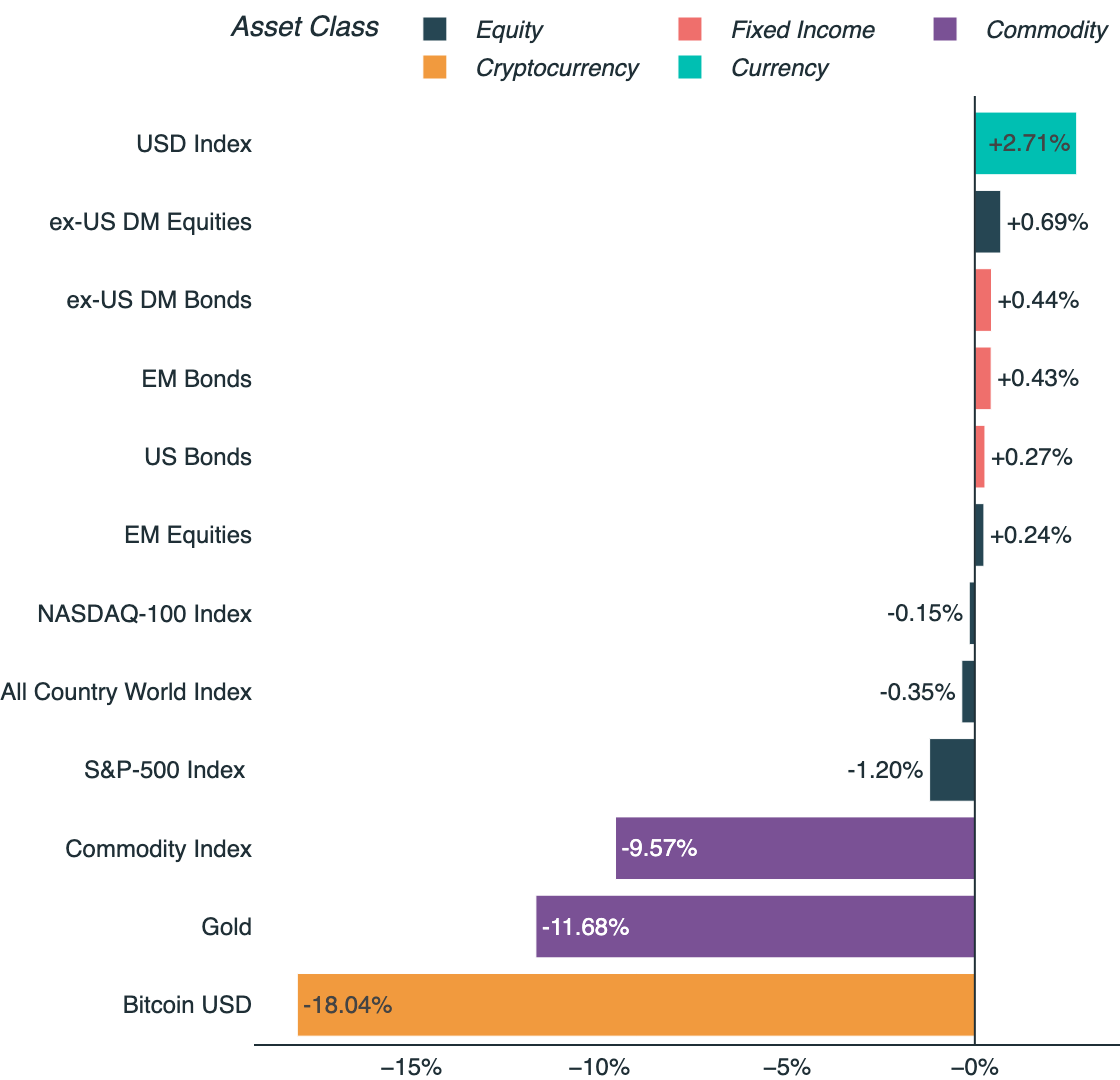
Gold built on its January rally, adding a further 8.72% in February to cement its position as the top-performing asset class across both months. Non-US equities continued to outpace their US counterparts, while Bitcoin compounded its January losses with a sharp further decline of 21.91%.

Cumulative return, February 2026
Country equity markets
South Korea picked up where January left off, adding 23.60% in February to remain the top-performing equity market across both months. Denmark, by contrast, reversed its earlier gains to finish at the bottom of the ranking, falling 11.26%.

Cumulative return, vs. All Country World Index, February 2026
Volatility
Having closed January below the 10-year average, short-term volatility picked up in February, spiking mid-month to a peak of 21.77 before easing to close at 19.95—modestly above the long-run average of 18.38. Medium-term volatility remained elevated at 23.68, with the curve in contango: near-term volatility below medium-term levels.
")
S&P-500 Index's implied volatility based on CBOE Volatility Index (VIX)
Currencies
The Australian Dollar, the top-performing currency in January, held its ground in February with a further gain of 1.52%. The Japanese Yen was the weakest major currency, declining 1.59%, while European currencies also lost ground across the board.

Cumulative return, February 2026
US sectors
The sector rotation that began in January carried into February. Defensive and real-asset sectors led the way—Utilities (+10.36%), Energy (+9.54%), and Materials (+8.42%)—while Financials, already the laggard in January, repeated at the bottom of the ranking with a loss of 3.82%. Seven of the 11 sectors finished the month in positive territory.

Cumulative return, vs. S&P-500 Index, February 2026
Portfolios
pfolio portfolios
All eight pfolio portfolios outperformed the All Country World Index in February, which returned 1.29%. The ETF - High Volatility portfolio led the field with a gain of 14.07%, while ETF - ESG - Low Volatility posted the most modest return at 2.13%.

Cumulative return, vs. All Country World Index, February 2026
Disclaimer
Continue reading
Get started now
