

June 2026
For definitions and explanations of the numbers and charts below, read this article.
Summary
- Asset classes: Top USD Index +2.71% vs. Bottom Bitcoin USD −18.04% vs. All Country World Index −0.35%
- Countries: Top Netherlands +5.95% vs. Bottom Israel −11.81% vs. All Country World Index −0.35%
- Volatility: Short-Term 16.45 vs. Medium-Term 21.50 vs. 10-Year Average 18.53
- Currencies: Top USD Index +2.71% vs. Bottom AUD Index −3.20%
- US sectors: Top Industrials +7.25% vs. Bottom Communication −7.16% vs. S&P-500 Index −1.20%
- pfolio portfolios: Top Stock - Crypto - High Volatility +6.34% vs. Bottom Stock - ESG - High Volatility +0.04% vs. All Country World Index −0.35%
Markets
Asset classes
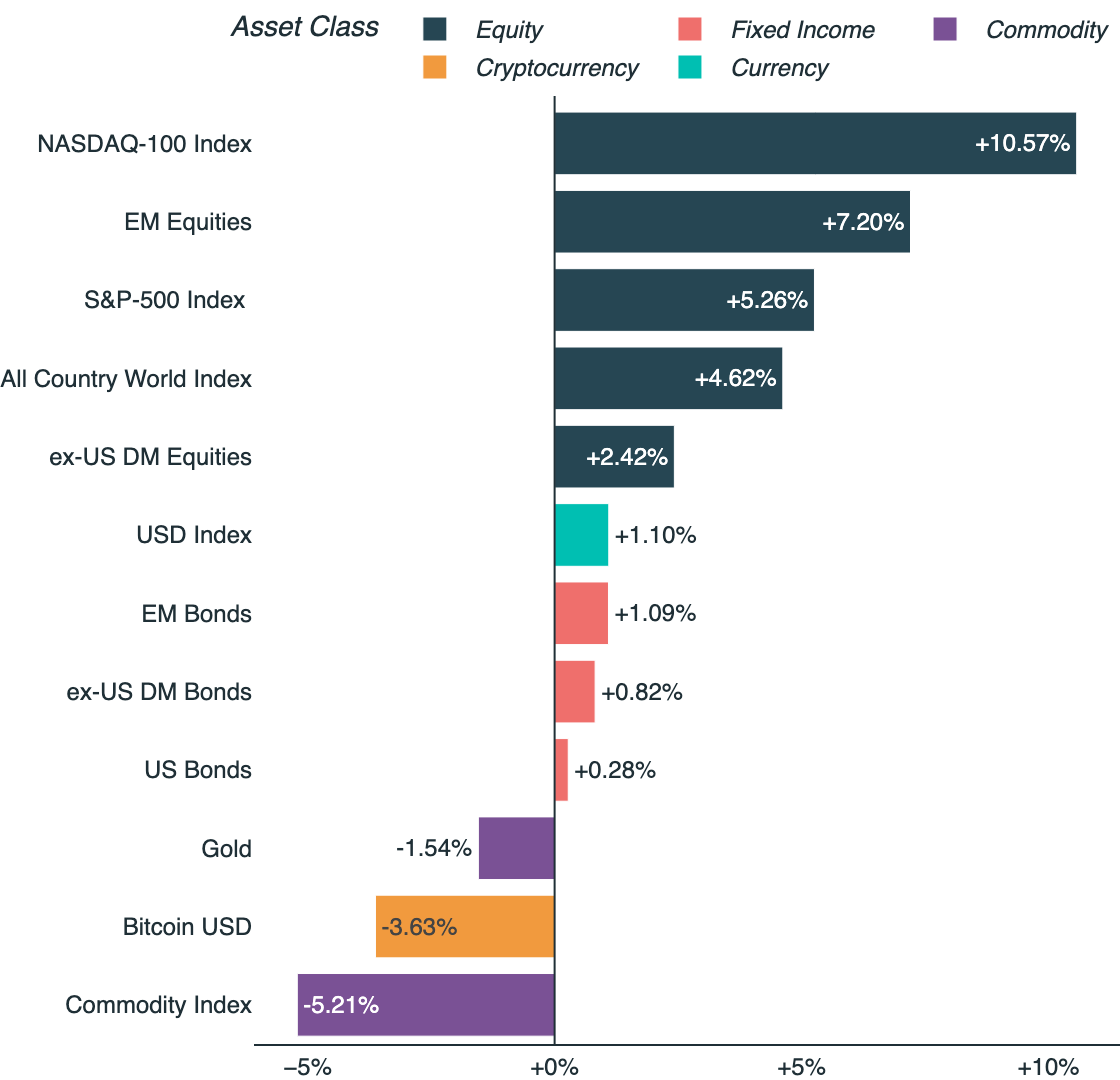
The US Dollar Index topped the asset-class ranking in June with a gain of 2.71%, the sole notable riser as risk assets broadly retreated against an All Country World Index decline of 0.35%. Bonds eked out small gains across the board, while equities were mixed—the NASDAQ-100 Index slipped 0.15% and the S&P-500 Index fell 1.20%. Bitcoin finished at the bottom of the ranking with a decline of 18.04%, a sharp reversal from May, followed by Gold at −11.68% and the Commodity Index at −9.57%.

Cumulative return, June 2026
Country equity markets
The Netherlands led country equity markets in June with a gain of 5.95%, narrowly ahead of Taiwan at 5.67% and Austria at 4.85%, against an All Country World Index decline of 0.35%. South Korea, May's runaway leader at +28.04%, gave back 1.91%. Israel finished last with a decline of 11.81%, just below Norway at −11.47%, while Indonesia—May's weakest market—fell a further 9.41%.

Cumulative return, vs. All Country World Index, June 2026
Volatility
Short-term volatility spiked early in June, peaking at 22.22, before drifting lower to close the month at 16.45—again below the long-run average of 18.53, though above May's 15.32 reading. Medium-term volatility eased to 21.50. The curve remained in steep contango throughout, with medium-term readings holding well above near-term levels.
")
S&P-500 Index's implied volatility based on CBOE Volatility Index (VIX)
Currencies
The US Dollar Index extended its lead among major currencies in June with a gain of 2.71%, building on its 1.10% rise in May. Every other major currency index fell: the British Pound Index held up best with a decline of 0.56%, while the Australian Dollar Index finished last at −3.20%, just below the Swiss Franc Index's 2.18% fall.

Cumulative return, June 2026
US sectors
Industrials led the US sector ranking in June with a gain of 7.25%, followed by Health Care at 6.62% and Financials at 4.30%, against an S&P-500 Index decline of 1.20%. Technology, May's standout at +19.76%, gave back 0.14% to sit mid-pack. The Communication sector finished at the bottom with a decline of 7.16%, below Energy at −4.97%.

Cumulative return, vs. S&P-500 Index, June 2026
Portfolios
pfolio portfolios
All eight pfolio portfolios finished June in positive territory, and every one beat the All Country World Index's decline of 0.35%. Stock - Crypto - High Volatility led the field with a gain of 6.34%, followed by ETF - Medium Volatility at 2.34% and ETF - Low Volatility at 1.84%. Stock - ESG - High Volatility finished last but still edged out a gain of 0.04%.

Cumulative return, vs. All Country World Index, June 2026
Disclaimer
Continue reading
Get started now
