

May 2026
For definitions and explanations of the numbers and charts below, read this article.
Summary
- Asset classes: Top NASDAQ-100 Index +10.57% vs. Bottom Commodity Index −5.21% vs. All Country World Index +4.62%
- Countries: Top Korea, Republic of +28.04% vs. Bottom Indonesia −14.80% vs. All Country World Index +4.62%
- Volatility: Short-Term 15.32 vs. Medium-Term 21.60 vs. 10-Year Average 18.52
- Currencies: Top USD Index +1.10% vs. Bottom GBP Index −0.39%
- US sectors: Top Technology +19.76% vs. Bottom Energy −5.63% vs. S&P-500 Index +5.26%
- pfolio portfolios: Top Stock - High Volatility +9.90% vs. Bottom ETF - Crypto - High Volatility +1.49% vs. All Country World Index +4.62%
Markets
Asset classes
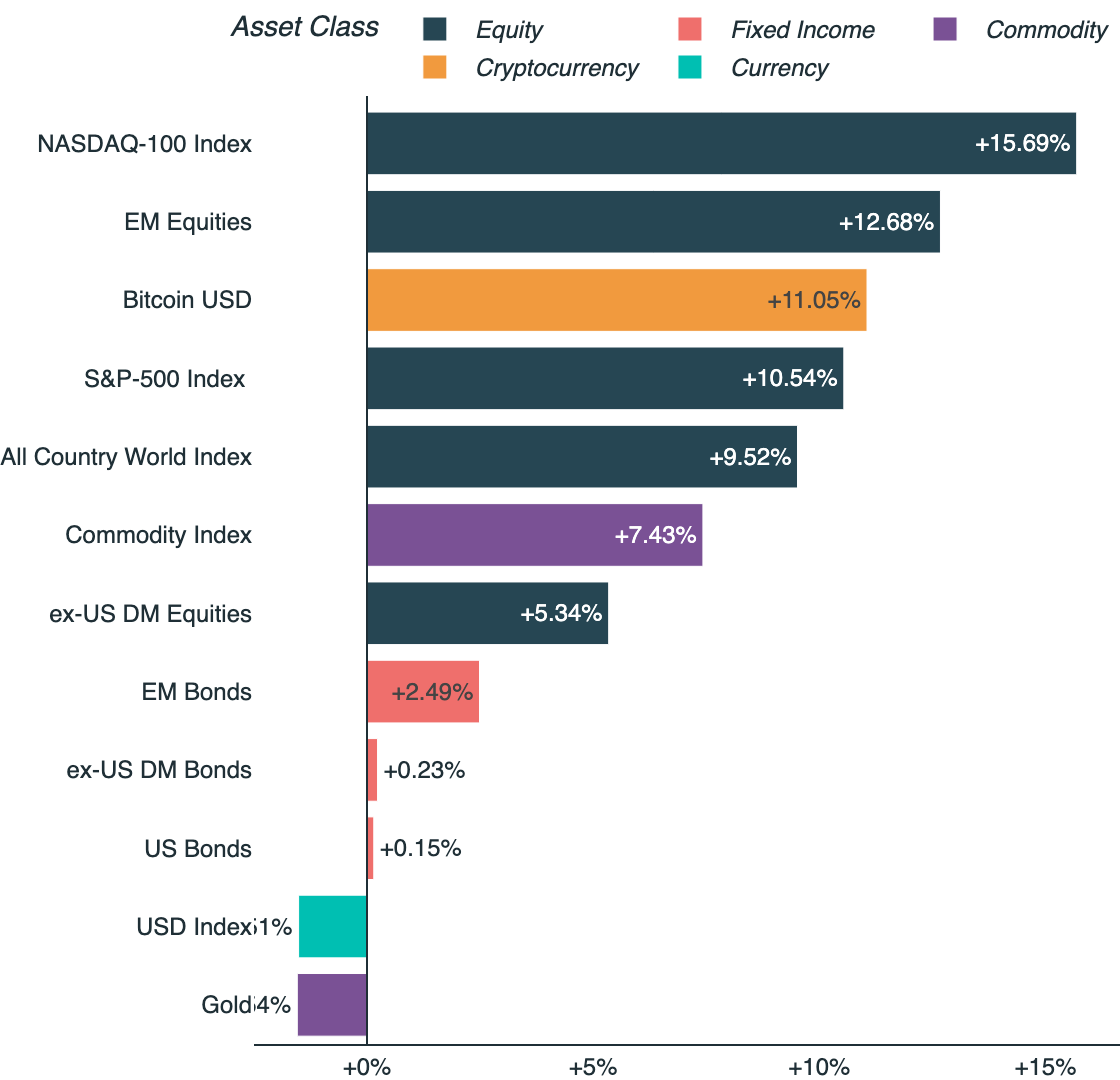
The NASDAQ-100 Index led asset classes for a second straight month in May with a gain of 10.57%, against an All Country World Index gain of 4.62%. The Commodity Index finished at the bottom of the ranking with a decline of 5.21%, while Gold slipped 1.54% and Bitcoin fell 3.63%.

Cumulative return, May 2026
Country equity markets
South Korea held the top spot for a second consecutive month with a gain of 28.04%, followed by Taiwan at 14.35%. Indonesia again closed the month at the bottom of the ranking, with a decline of 14.80% against an All Country World Index gain of 4.62%—a steeper fall than its 5.45% loss in April, when it also finished last.

Cumulative return, vs. All Country World Index, May 2026
Volatility
Short-term volatility continued to drift lower through May, closing at 15.32—below both the 16.89 reading at the end of April and the long-run average of 18.52. Medium-term volatility eased to 21.60. The curve remained in steep contango, with medium-term readings holding well above near-term levels throughout the month.
")
S&P-500 Index's implied volatility based on CBOE Volatility Index (VIX)
Currencies
The US Dollar Index led major currencies in May with a gain of 1.10%, reversing from the bottom of the ranking in April. The Swiss Franc Index followed at 0.94%. The British Pound Index finished last with a decline of 0.39%, just below the Euro Index's 0.38% fall.

Cumulative return, May 2026
US sectors
Technology topped the US sector ranking for a second straight month with a gain of 19.76%, against an S&P-500 Index gain of 5.26%. Energy remained at the bottom of the ranking with a decline of 5.63%—a deeper loss than its 2.63% fall in April, when it also finished last—followed by Utilities at −5.19%.

Cumulative return, vs. S&P-500 Index, May 2026
Portfolios
pfolio portfolios
Two of the eight pfolio portfolios beat the All Country World Index's gain of 4.62% in May, and every portfolio finished the month in positive territory. Stock - High Volatility led the field with a gain of 9.90%, followed by Stock - Crypto - High Volatility at 6.51%. ETF - Crypto - High Volatility finished last but still posted a gain of 1.49%.

Cumulative return, vs. All Country World Index, May 2026
Disclaimer
Continue reading
Get started now
