


Analysing your investments
The Investments Overview is where you read what you have logged in the Trade Log. It holds four sections: Net Asset Value, Positions, Cash Flow, and Investment Data. Net Asset Value and Cash Flow are built from your transactions, so those charts appear only once you have tracked transactions. With positions alone you still get the Positions and Investment Data sections, and an alert points you to the Trade Log to unlock the rest. Figures are shown in the base currency you set in the Trade Log.
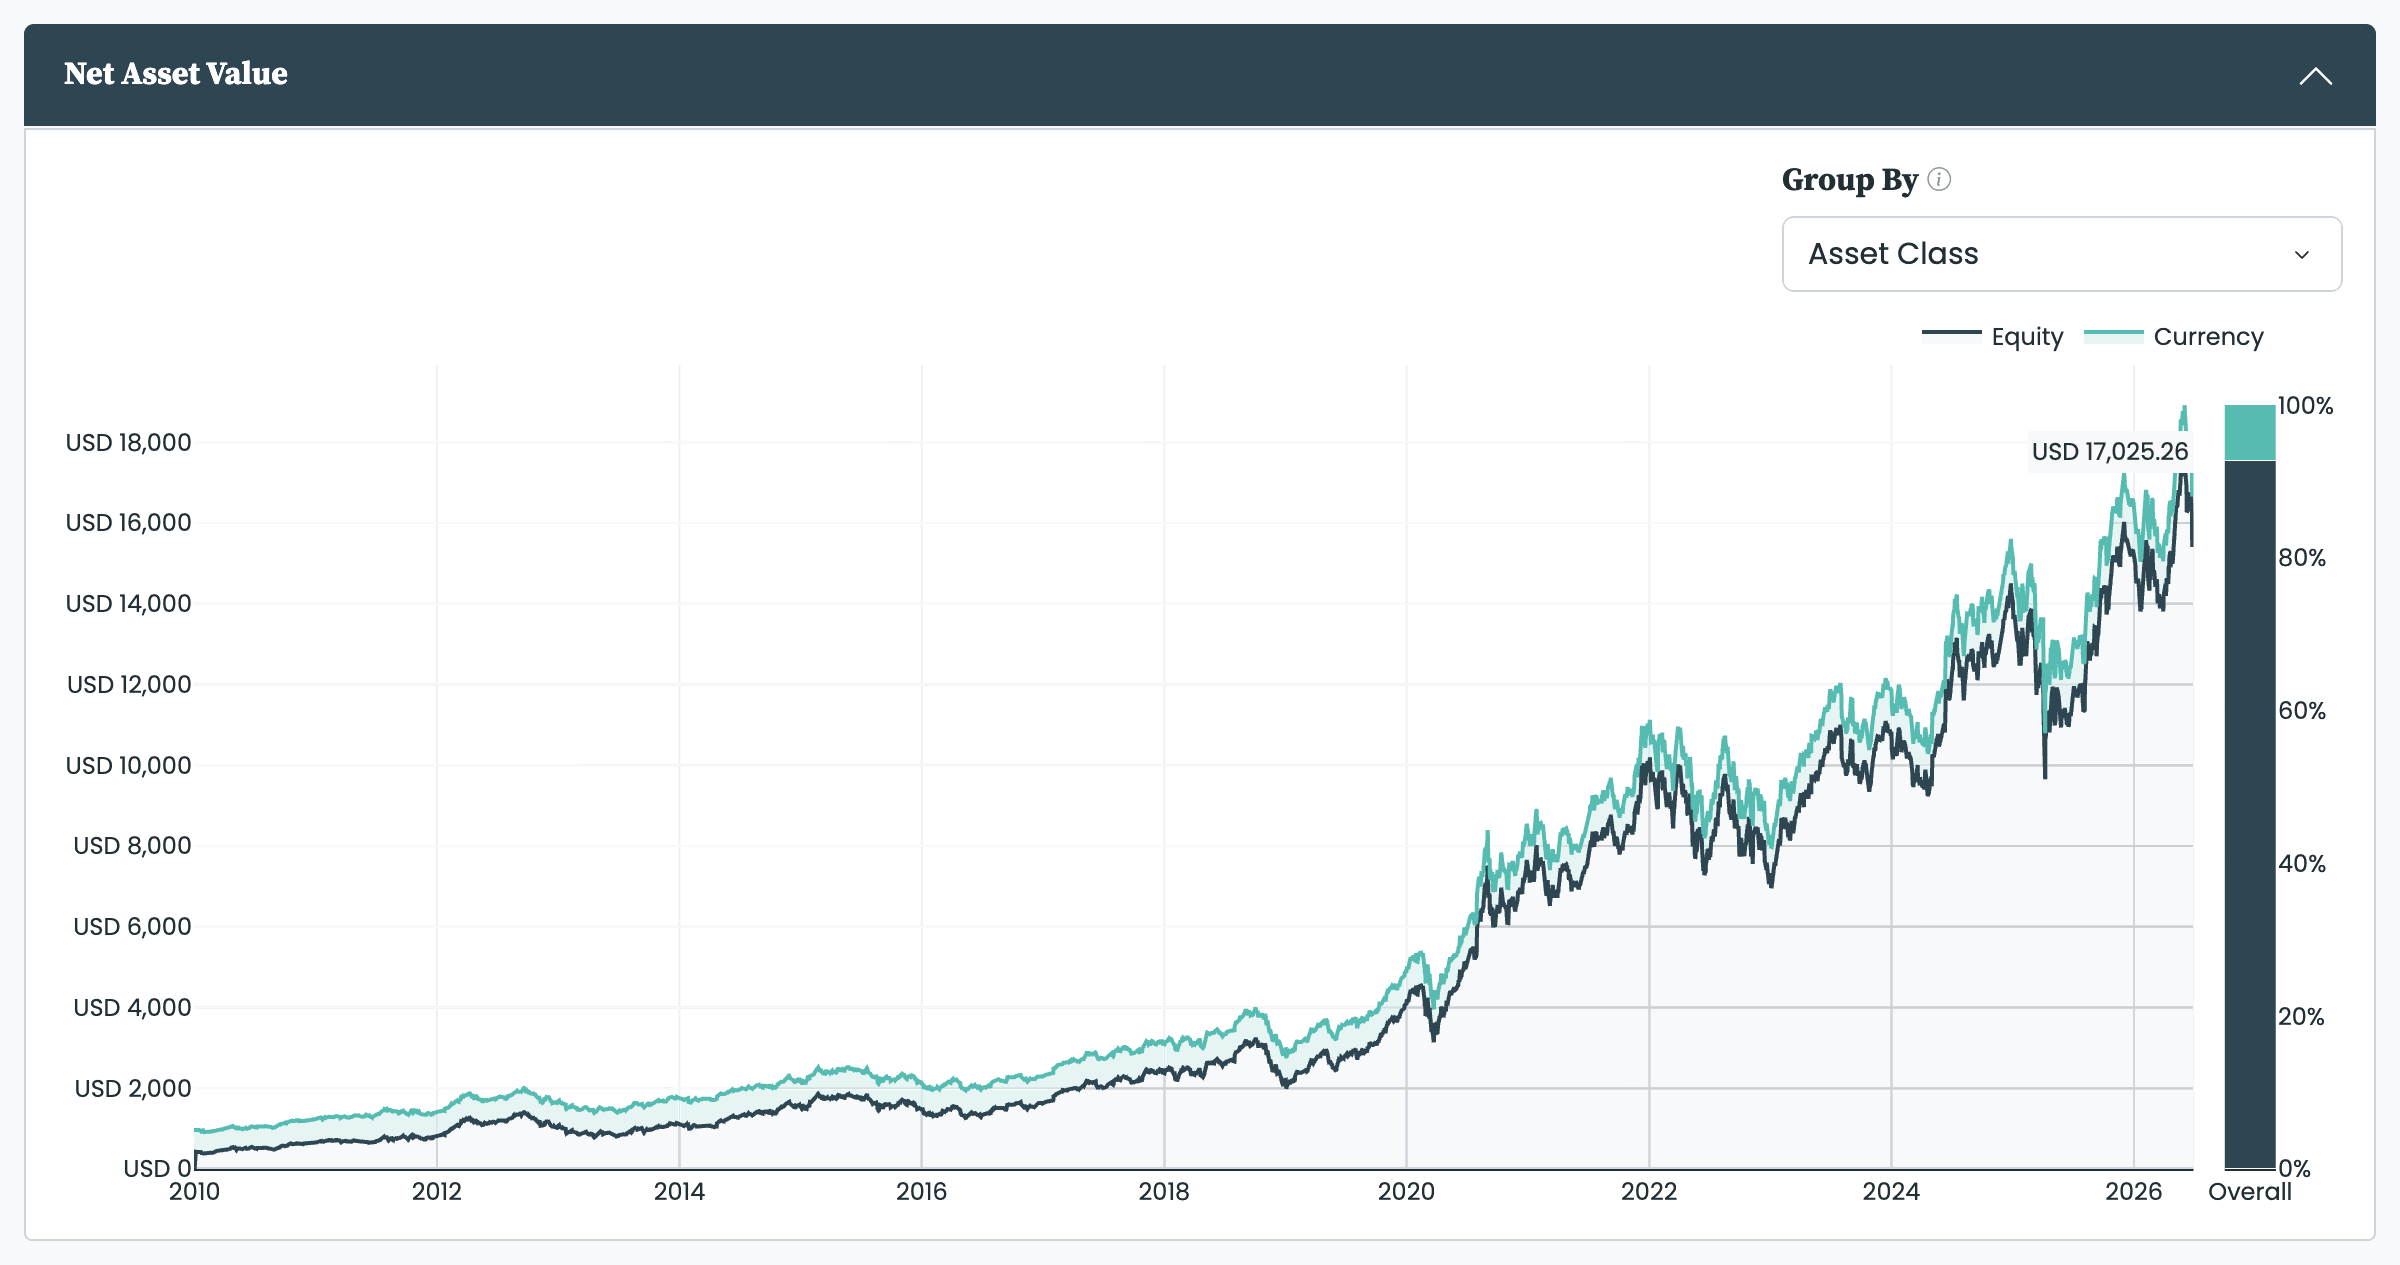
The Net Asset Value chart plots how your NAV has moved over time, calculated from the transactions you logged. Its Group By control breaks the total down by asset category—Asset, Asset Type, Asset Class, Region, Subregion, Country, or Country Development—so you can see which holdings drive the value. A label in the top-right shows your current net asset value.
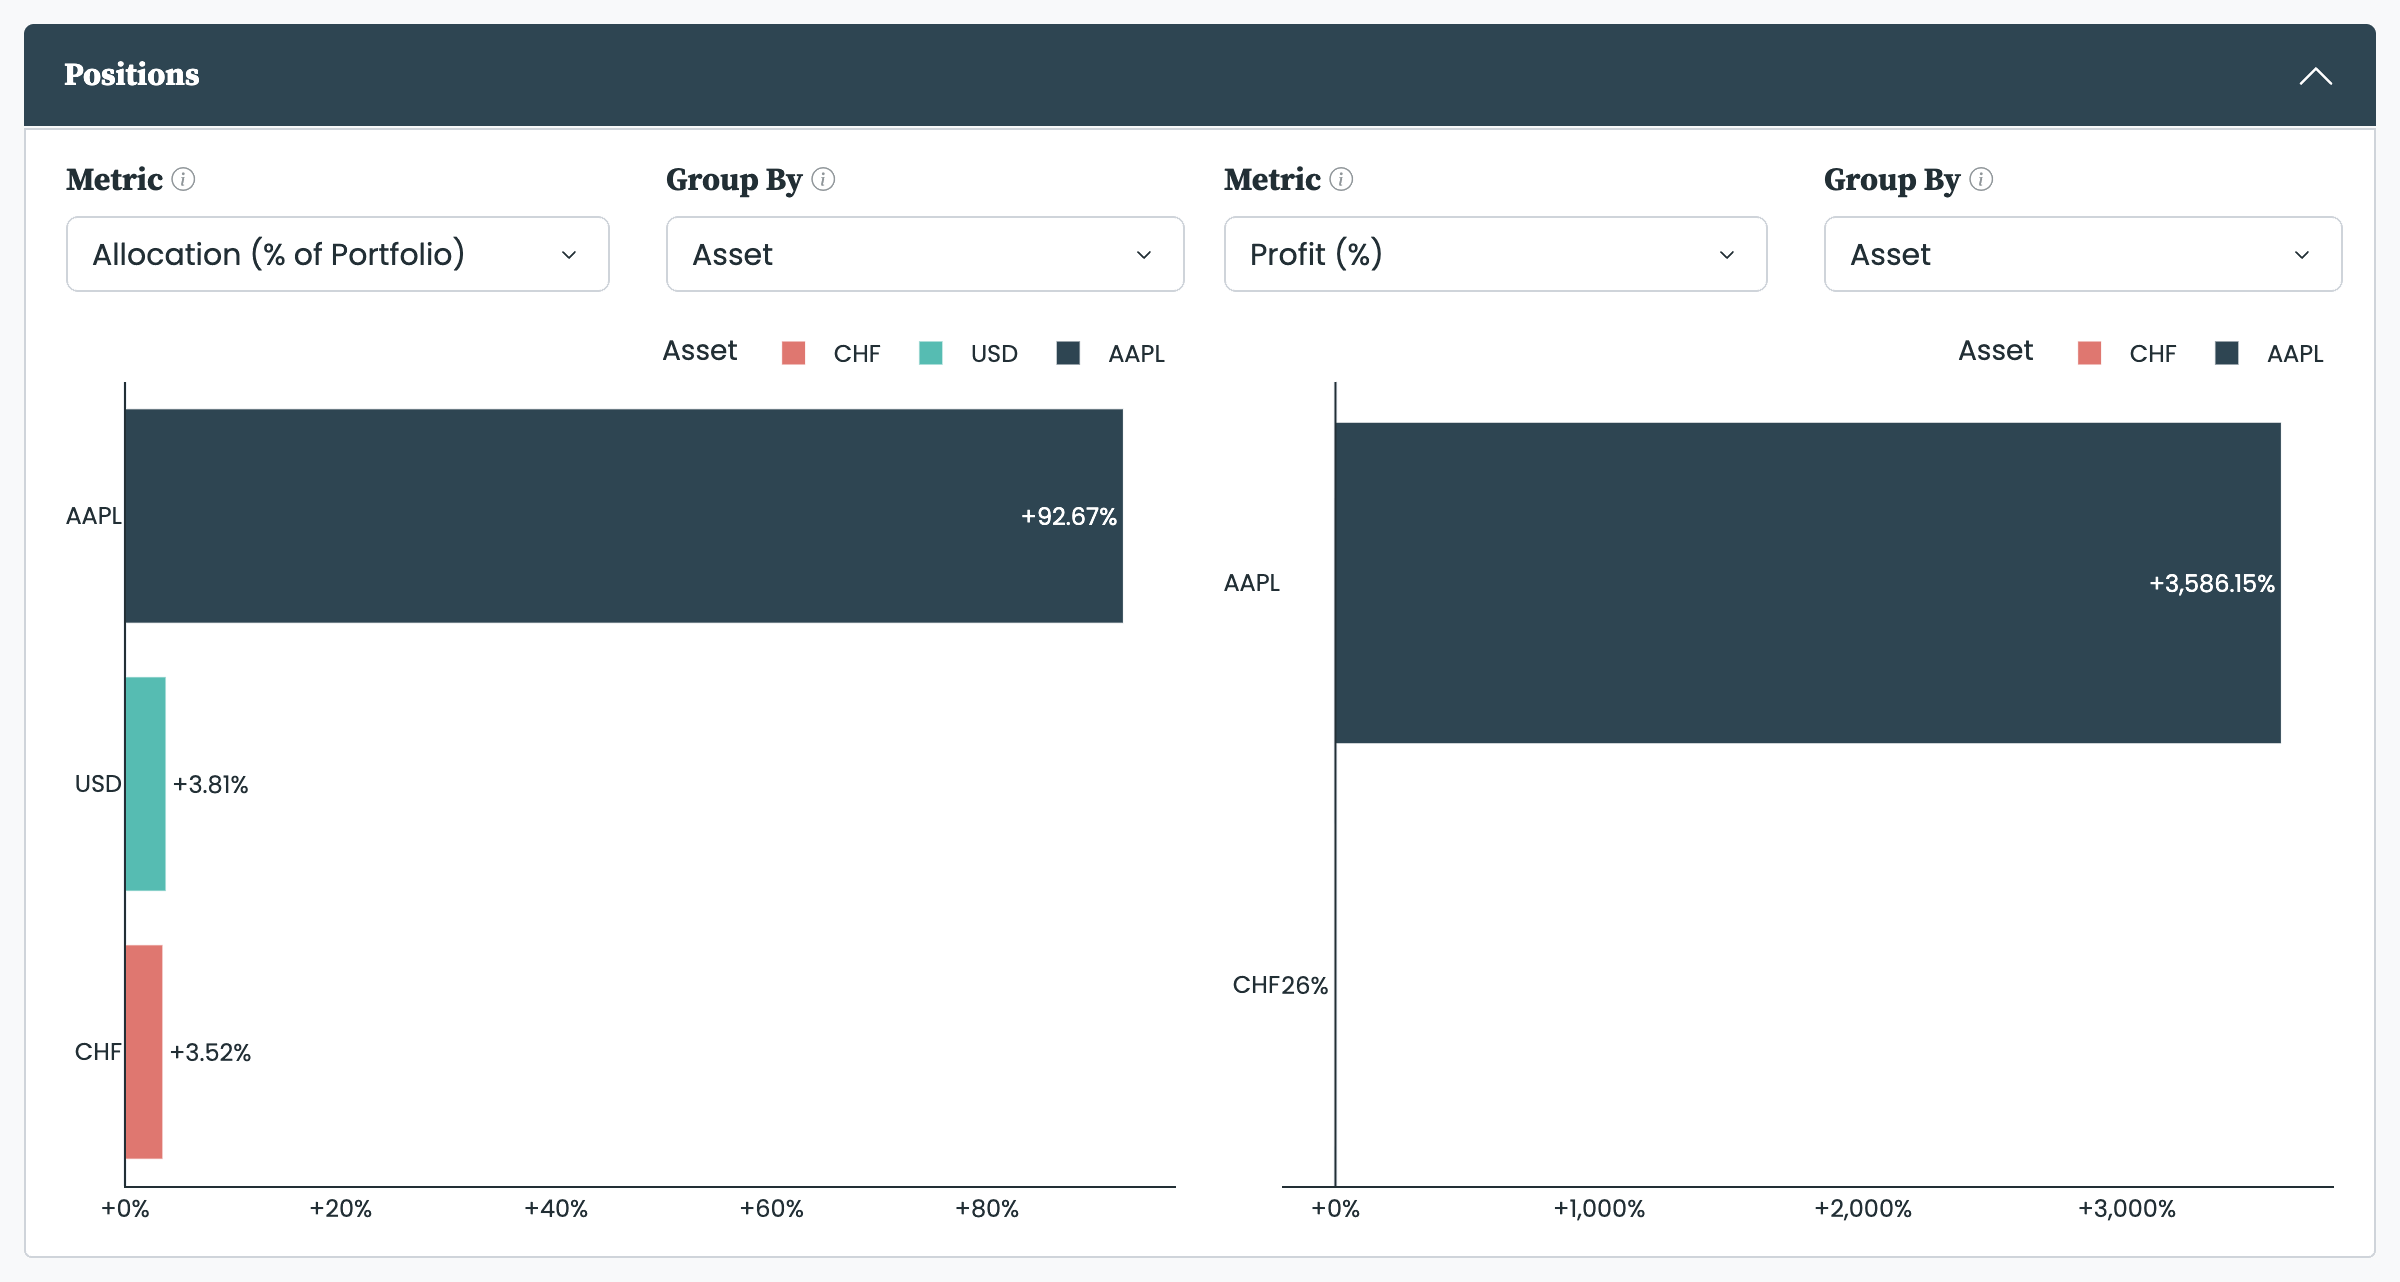
The Positions section holds two charts side by side, each configured on its own, so you can read two views of your current holdings at once. Every chart has a Metric selector and a Group By selector.
The Metric options are:
- Profit (%): the holding's gain or loss against what you paid for it—its return on its own cost.
- Profit (% of Portfolio): the holding's share of your portfolio's total profit.
- Profit (Absolute): that gain or loss, in your base currency.
- Allocation (% of Portfolio): the holding's current value as a share of your whole portfolio.
- Allocation (Absolute): the holding's current value, in your base currency.
Group By aggregates the holdings by the same asset categories as the Net Asset Value chart, so you can view, for example, profit by asset alongside allocation by region. For exactly how each metric is calculated, see Investments calculations explained.
The Cash Flow chart shows the deposits and withdrawals running into and out of your investments over time. Its Group By control sets the time aggregation—Day, Month, or Year.
The Investment Data section exposes the underlying data for your investments, treated as a single asset. It is the same Asset Data view that every asset—and every built portfolio—has, applied here to your investments as a whole: a Data Quality table (the first and last day of history, missing days, and the largest daily moves) and the Price Data series itself. Download exports the time series as a CSV file; it is available with the Export add-on. For what each Data Quality figure means and how the series is built, see Processing asset data.
Tracking your investments also creates the asset list My Investment Positions, holding every asset you currently hold, and a combined series that represents all your investments together. Both can be opened in the Insights tools like any other asset—compare your holdings against each other, or run the full metric suite over your investments as a whole. Because the combined series is treated as a portfolio, its allocation charts display just as a portfolio's do—see Understanding the allocation charts. To read what the other charts and metrics mean, see Time series data and metric types. To turn this picture into trades, see Rebalancing your portfolio.


