


Processing asset data
Every asset passes through the same processing engine before it is stored, whether it was imported, downloaded from a data provider, or built with one of the asset-building options. The engine produces a single canonical daily series so that all assets are directly comparable:
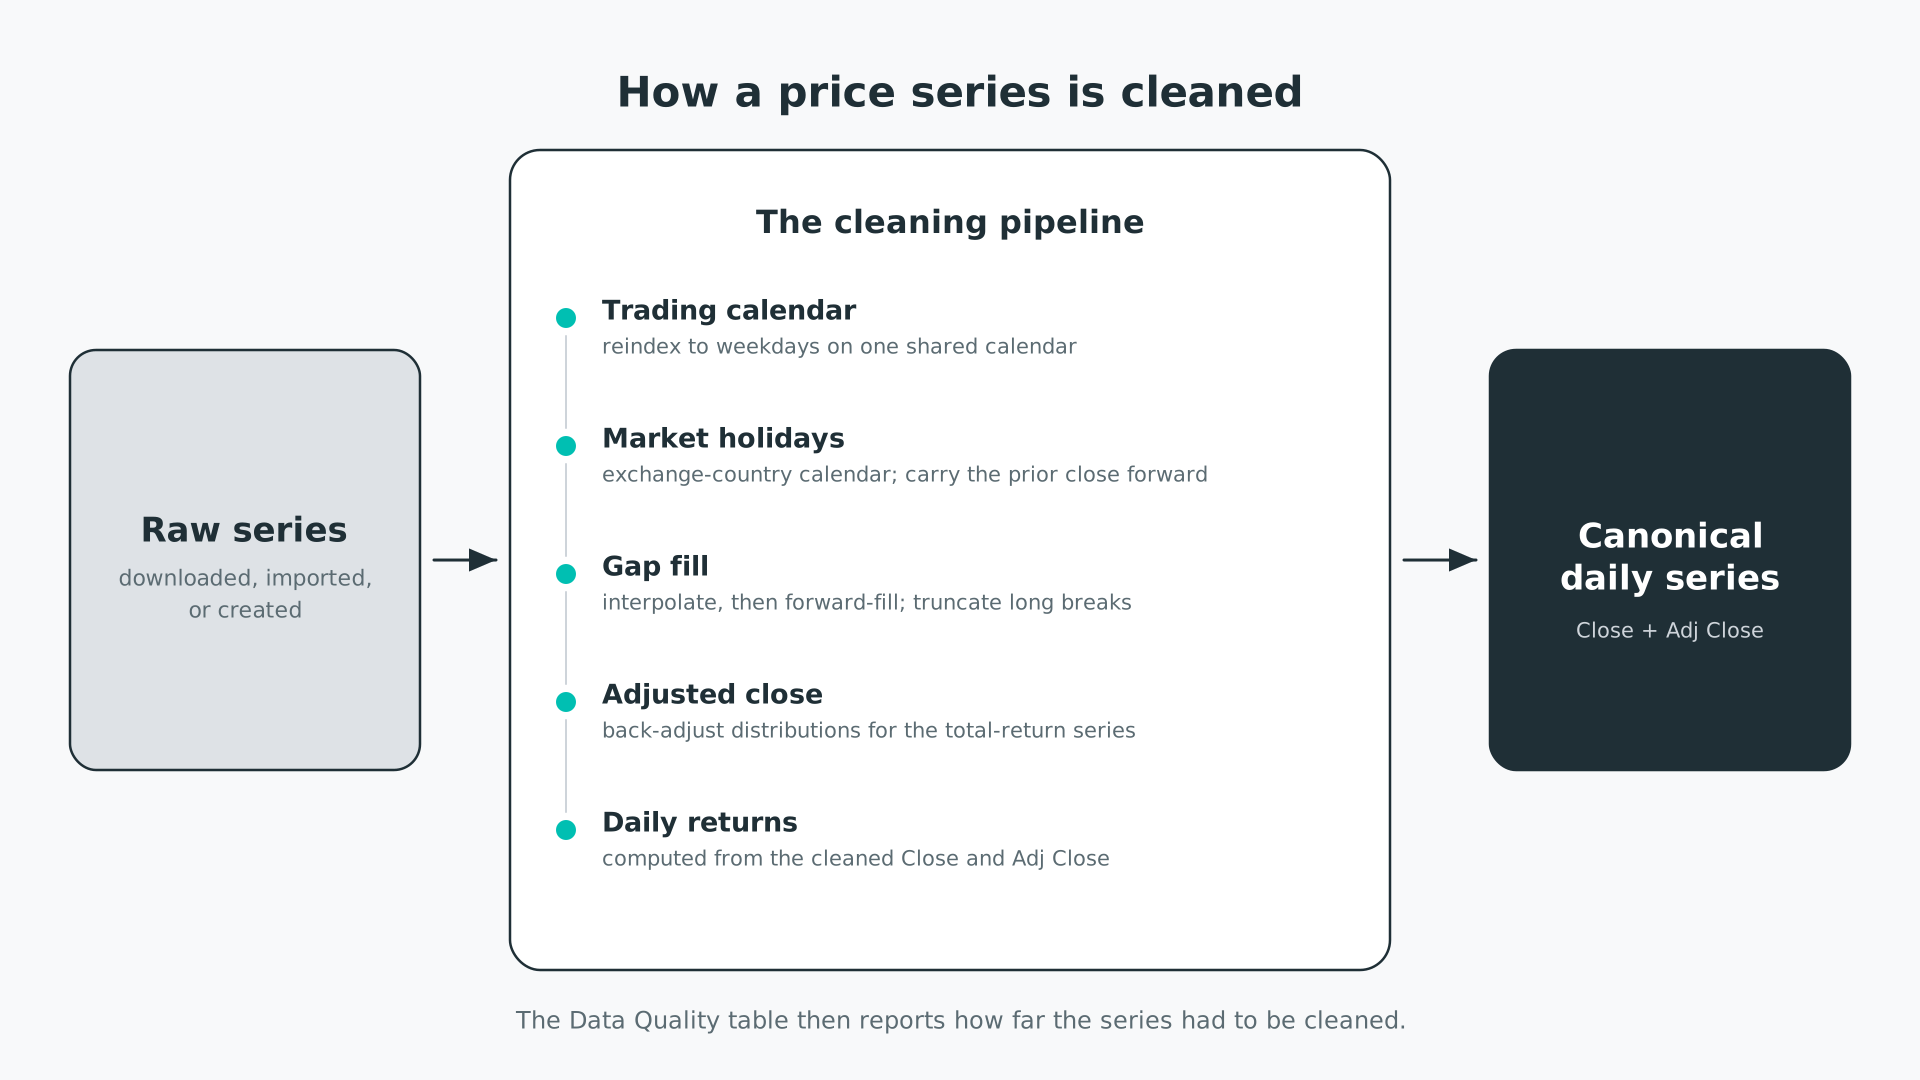
How pfolio turns a raw price series into one clean daily series.
- Trading calendar. The series is reindexed to weekdays between its first reliable day and the most recent completed business day. Weekends are excluded.
- Market holidays. Days the asset's exchange was closed are filled by carrying the prior day's close forward. Which days count as holidays comes from the asset's Country attribute—the country it trades in—and pfolio applies that country's market-holiday calendar. If you own the asset, you can change its Country in asset attributes, which switches the holiday calendar used here.
- Other gaps. Any remaining missing values are linearly interpolated and then forward-filled.
- Long breaks. If the history contains a gap longer than roughly two weeks, the series is truncated to begin after that gap, so a single long break does not distort the record.
- Adjusted close. Where distribution data is available, pfolio derives the adjusted close by applying each distribution backward across all earlier prices—the standard total-return adjustment.
- Daily returns. Close and adjusted-close returns are computed from the cleaned prices.
This is why pfolio distinguishes two price series throughout the platform. Close tracks the asset's daily price movements; Adj Close tracks its daily total return, including any cash distributions—dividends and interest payments—and their reinvestment. The metrics built on these series are described in Time series data and metric types.
The Asset Data tab of the Asset Builder reports the health of the processed series in the Data Quality table:
| Column | What it tells you |
|---|---|
| First Day | Start of the processed series |
| Last Day | End of the processed series |
| Last Days Missing | Trailing days with no source data, filled by the engine |
| Max Days Missing | The longest gap that had to be filled anywhere in the history |
| Close Price - Max Daily Move | Largest one-day move in the Close series, as a percentage—a quick check for spikes or bad ticks |
| Adj Close Price - Max Daily Move | Largest one-day move in the Adj Close series, as a percentage |
| Close Price vs. Adj Close Price - Max Daily Delta | Largest one-day gap between the two series; surfaces how much distributions pull the total-return series away from the price series |
A series with many filled days, an oversized maximum daily move, or an unexpected close-versus-adjusted-close delta is worth inspecting before relying on its metrics.
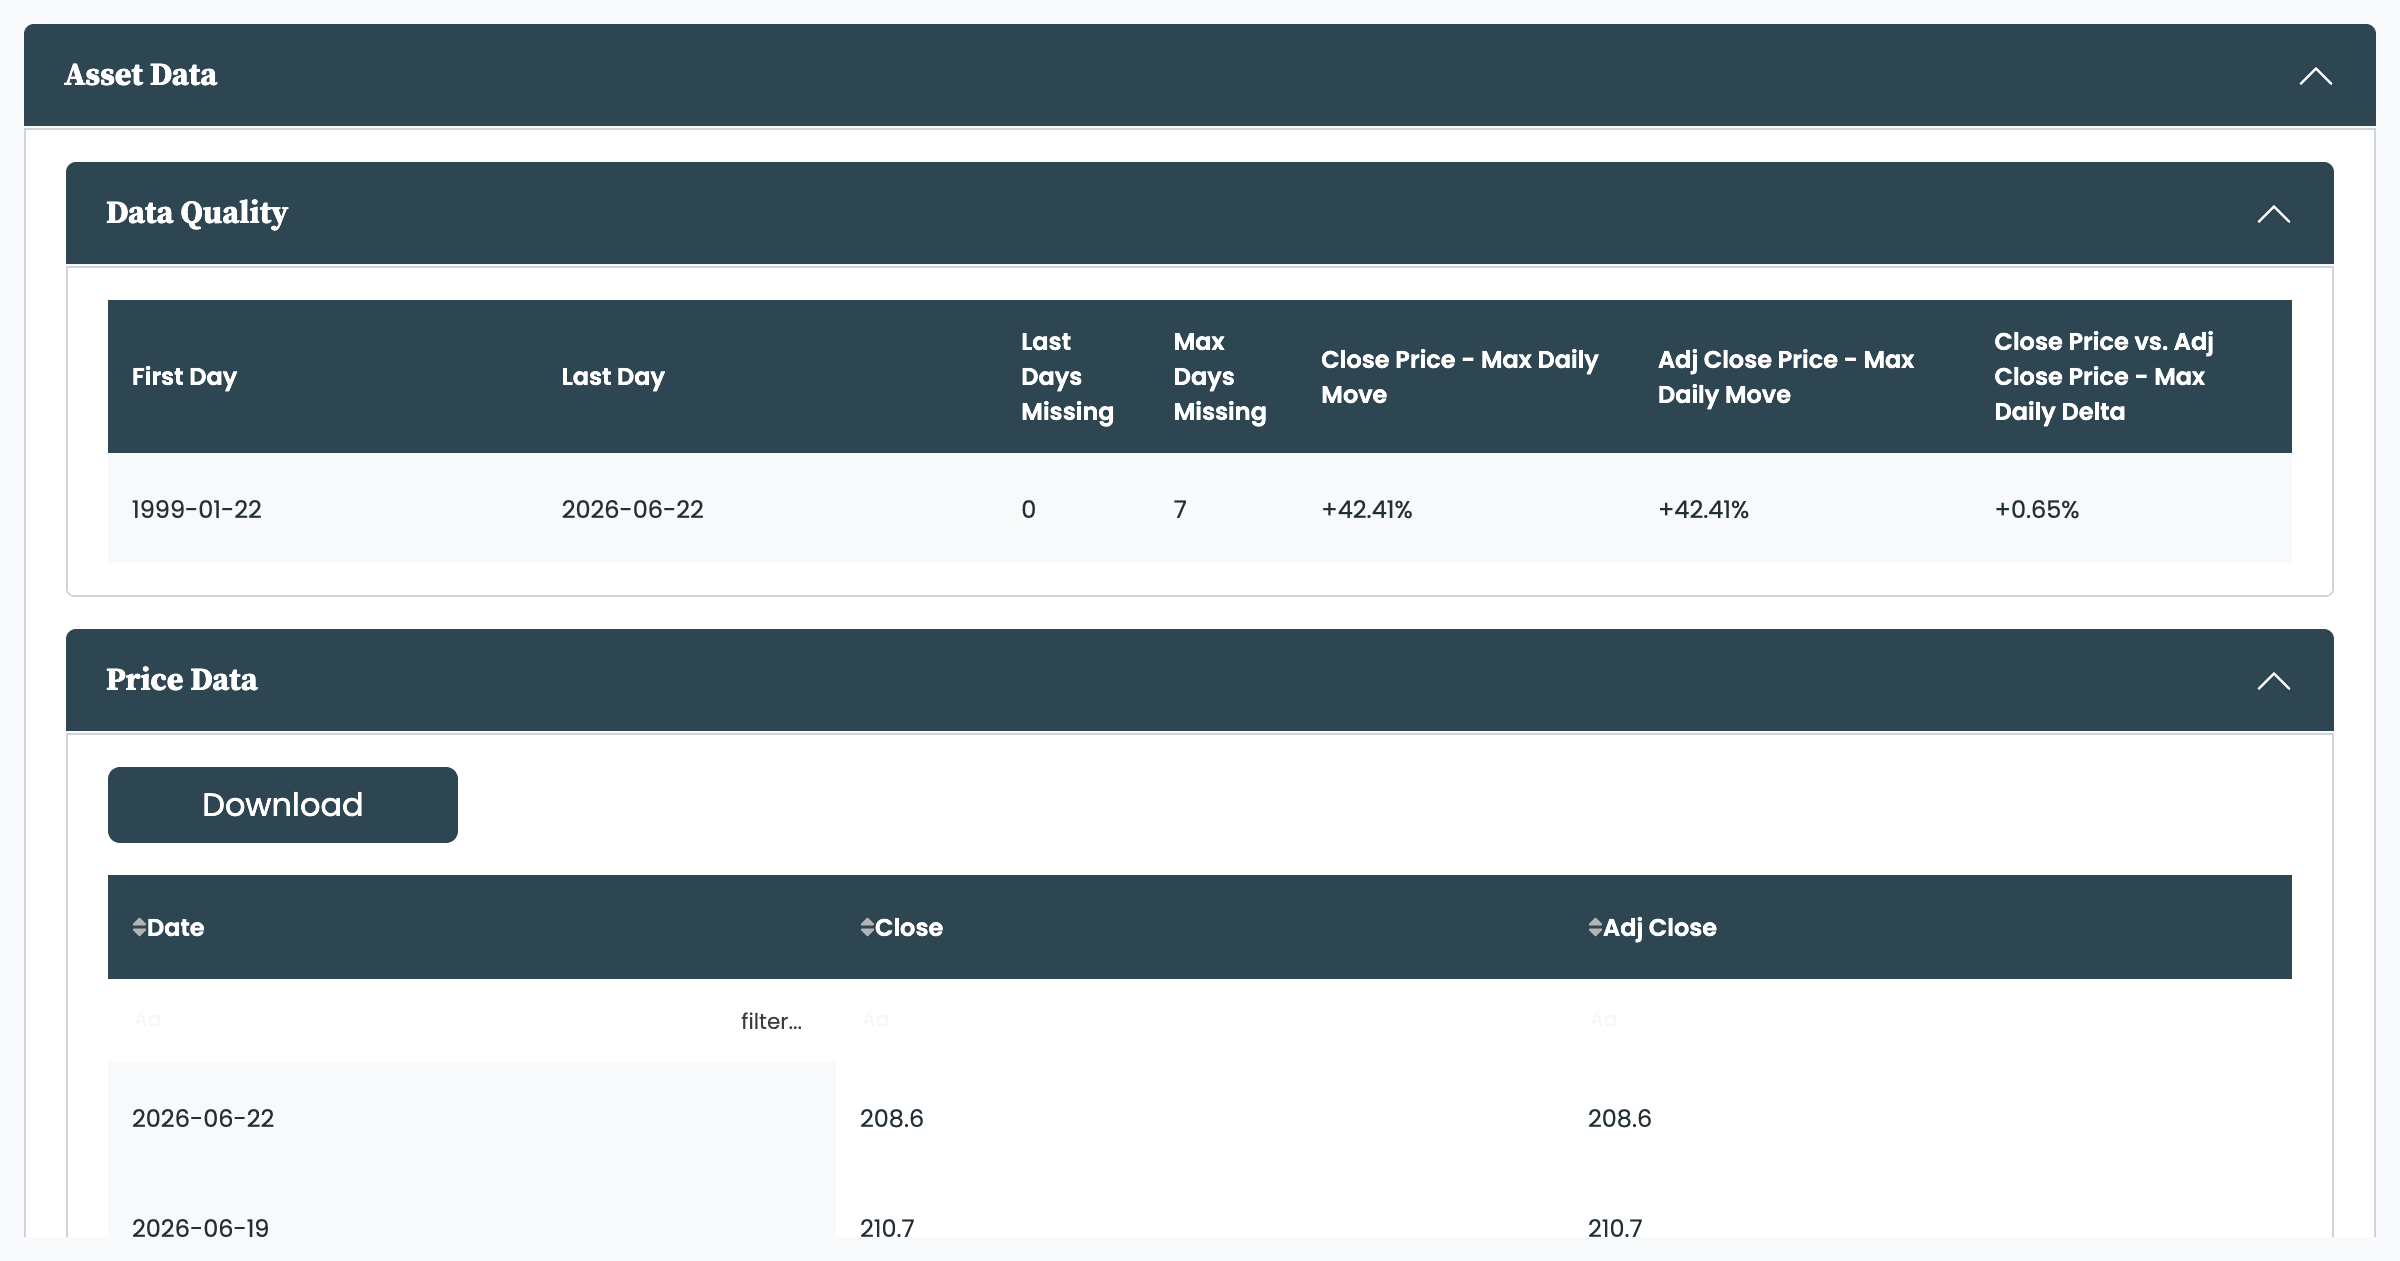
The Price Data table shows the processed series itself, newest day first, with one row per day across Date, Close, and Adj Close. The table is sortable, and filterable once it is long enough. The Download button exports the series as a file. Downloading requires the Export add-on; without it the button is disabled and an alert links to where the add-on is activated.


